By Talia Kaufmann, Ph.D. Candidate at the School of Public Policy and Urban Affairs, Northeastern University
Note: Talia Kaufmann’s dissertation research is partially supported by a grant from the NULab for Texts, Maps, and Networks.
Which cities provide the majority of their residents good accessibility to services? And how can we start quantifying accessibility levels in fine-grain resolutions to assist city planners in making location decisions?
Cities are in great need of quantitative metrics to assess urban performance and better distribute services between urban neighborhoods. The current era of ‘big data’ has enabled the development of such metrics with open and large datasets mapping amenities in cities across the world. In collaboration with the Urban Unit at the Center for Entrepreneurship, SMEs, Local Development and Tourism (CFE) and the International Transport Forum (ITF) at the OECD, this project measures accessibility to services in cities across the world with the goal of creating a ranking of cities by the level of accessibility to services they provide to their urban dwellers.
Combining a large scale dataset extracted from Google Maps with data about the spatial distribution of population across the world, we measure exact travel durations by walking, driving, and public transportation from population concentrations in cities in the USA, UK, France, Germany, Norway, and Sweden. The unique synthesis of these two datasets allows us to assess what can be considered as accessible from one’s home, estimated with respect to the levels of accessibility measured both in a particular city and across cities. Using the fine-grain resolution index of the Google dataset, we measure accessibility levels for most urban amenities ranging from the daily necessities such as supermarkets, parks, and schools to commercial facilities such as restaurants and bars and public facilities as hospitals and libraries.
Measuring the spatial distribution of amenities and services in cities around the world sheds light on the inequalities amongst urban neighborhoods provides both data-driven metrics to support location decisions in future planning efforts and a benchmark to compare cities by the level of accessibility they provide to their residents.
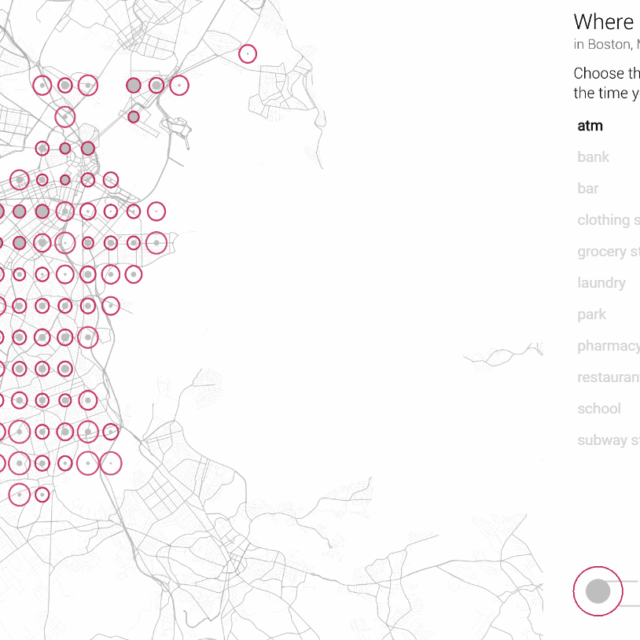
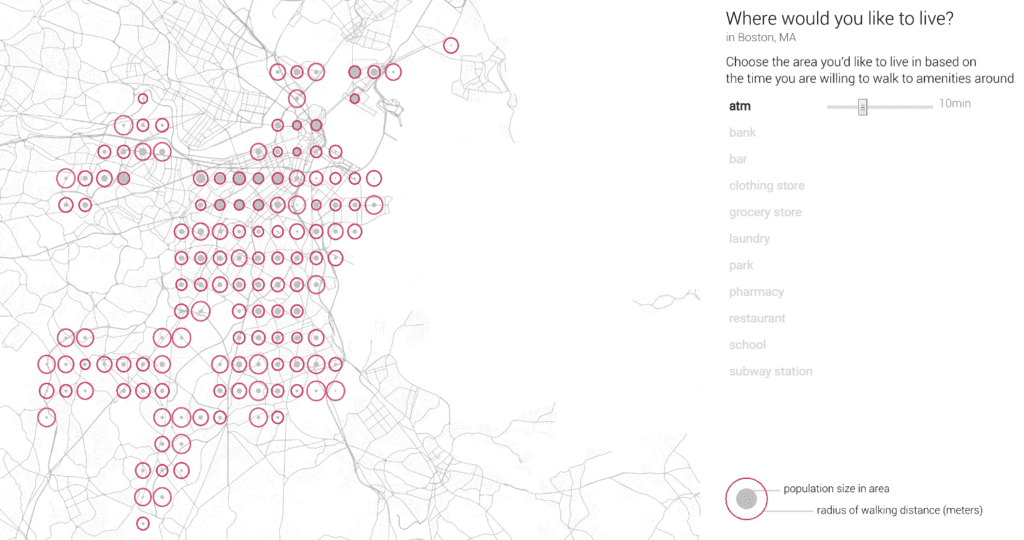
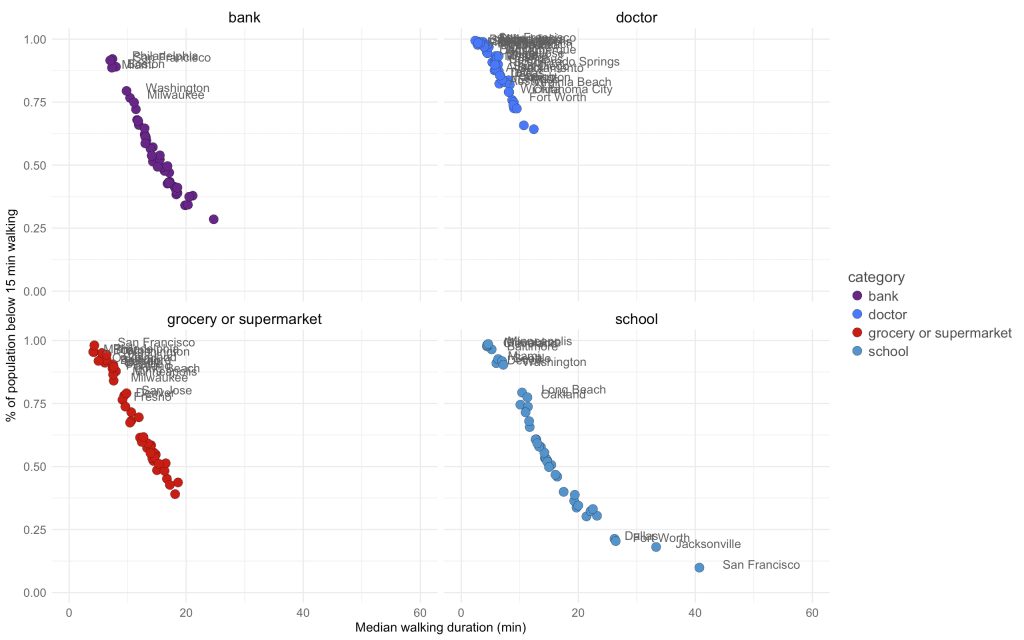
Initial results measured in the largest 50 cities in the US, show that while some amenities, such as doctors and restaurants, are highly accessible in most cities, available within 10 minutes of walking for more than 65% of the urban population, other amenities, such as parks, banks and schools vary tremendously in their accessibility levels between cities. As might be expected, accessibility levels also varies within each city. In Boston, for example, more than 85% of the urban community has the closest park, supermarket, school, bank or pharmacy located within less than 15 minutes walking. However, subway stations are significantly less accessible in Boston, with a mean walking distance of 20 minutes accounting for only 45% of the city’s population.
Explore more of Boston’s accessibility in this data visualization.


