I was very fortunate, in my capacity as a 2021-2022 NULab Fellow, to have an opportunity to work with survey data from COVID States Project at Northeastern University’s Network Science Institute. COVID States Project represents an ongoing collaboration between faculty and students at Northeastern, as well as researchers from Harvard University, Rutgers University and Northwestern University. As a doctoral student in the field of sociology, I have always been keen on polishing my survey data analysis skills. I’ve encountered numerous scholarly articles and books where survey data was presented but have had only a few opportunities to see how the actual raw survey data is generated and processed by social scientists. I was also lucky to explore my research interests in populist political attitudes, and the role of economic anxiety and political mistrust in fueling anti-democratic sentiments. The massive scale of COVID States Project survey data and a myriad of socioeconomic and political questions that the survey featured allowed me to test many of my research hypotheses.
COVID States Project was launched in April 2020, in the early days of the pandemic, and has been administered periodically ever since, with 20,000 respondents sampled in each wave across all 50 states. As of spring 2022, the team behind the project has collected 20 waves of surveys, with questions focusing primarily on the pandemic and its various aspects, along with a wide range of questions meant to gauge the emotional and socioeconomic well-being of respondents, their political and ideological preferences. This occasional focus on respondents’ socioeconomic and political background was a great boon for a sociologist with my research interests in populism and economic anxiety. Kristin Lunz Trujillo, who generously offered me guidance through COVID States Project, happened to have very similar research interests, which resulted in a very productive research collaboration.
We decided early on that one particular set of variables from the survey that would allow us to understand the connection between socioeconomic factors and political ideology would be conspiracy theories and the conspiratorial mindset that makes people prone to believing in conspiracy theories. My personal research interests lie in the sub-fields of political and economic sociology, particularly, in the way in which economic factors, like economic insecurity and anxiety, drive anti-democratic political sentiments, such as authoritarian populism. Conspiracy theories and the conspiratorial mindset are some of the many components behind the complex, multi-faceted phenomenon of global right-wing populist movements. Though conspiratorial mindset and mistrust affect people on both sides of the political spectrum, many supporters of right-wing authoritarian politicians tend to strongly believe in conspiracy theories, the most prominent of which is Qanon and the now infamous Pizza Gate conspiracies (Bergmann 2018, Bracewell 2021). Though prior to this research project I rarely explored this area, scholarly literature on the topic suggests that conspiratorial mindset is strongly connected with skepticism and mistrust of public institutions, especially political and science-based bureaucracies. One could also add democratic institutions and hypothesize that there exists a potential link between the conspiratorial mindset and populist, anti-democratic attitudes. The pandemic has given rise to many conspiracies, such as the one according to which COVID-19 was a biological weapon designed in a lab or that vaccines have chips that track people’s movements and minds. Many of these pandemic-related conspiracy theories were included in some of the questions of COVID State project which allowed me to investigate the reasons why citizens in democratic countries would be inclined to believe in conspiracy theories. I was particularly interested in investigating whether economic insecurity and politically conservative beliefs, along with mistrust in public institutions and science, can explain why certain individuals would be prone to believing in conspiracy theories. In order to test these hypotheses, I relied on linear regression analyses which, though far from being the most accurate statistical method of data analysis, can equip the researcher with a strong sense of their dataset and potential connections between variables.
While I was eager to jump into hypothesis testing right away, I first needed to consider the challenges of working with massive survey datasets. The first step in my NULab project involved extensive data scanning and variable selection, along with relevant recoding of the variables. Before I could start building statistical models, I had to skim through the entire survey codebook which had hundreds of variables that were sometimes labeled cryptically, requiring extensive renaming and recoding on my part. The biggest challenge with survey datasets such as the one generated by COVID States Project, thus, comes from the sheer number of variables that each wave of surveys contains. In order to explore the variables more systematically and select variables of interest in a more authoritative fashion, I took a detour at this point and, in consultation with Kristin Lunz Trujillo who assisted me on this project, decided to review the relevant literature on the topic of conspiracy theories so that later, when I went back to the dataset, it was easier and faster for me to select the variables for model-building.
Scholarly literature on conspiracy theories and the individual characteristics that make one more predisposed towards believing in conspiracy theories is vast and multi-interdisciplinary, drawing on insights from social psychology and political science, among other disciplines. After reviewing major articles and books on the subject, I concluded that there were four major categories of variables that could explain why certain individuals were more likely to believe in COVID-19 related conspiracy theories, the questions on which were included in different waves of COVID States project. Some studies suggest that mistrust in science and government institutions more broadly is one such component (Simione et al. 2021). This sentiment is related to the question of social cohesion, as some scholars note that individuals who feel alienated, hopeless, precarious or isolated from their communities would also be more likely to believe in conspiracy theories (Bilewicz 2019). Occasionally, scholars also referenced economic factors, such as financial insecurity (van Prooijen and Douglas 2017) and political ideologies (Lewandowsky, Gignac, and Oberauer 2013), such as libertarianism, as additional components of the conspiratorial mindset. After collecting variables of interest, I assembled them under five concrete themes, with 3 to 7 variables per theme: the conspiratorial mindset, political ideology, economic anxiety, institutional mistrust and social cohesion. I built multiple regression models with variables from the conspiratorial mindset theme serving as my dependent variables in separate models, with variables from other themes used as independent or, as they are sometimes referred to, explanatory variables. In order to avoid some of the problems that arise in regression analysis, especially the issue of autocorrelation when the model captures the connection between independent variables rather than dependent and independent variables, I had to make sure there were no strong correlations between my independent variables. (Regression models, broadly speaking, explore the relationship between independent variables and a dependent variable. A “strong” regression model would illustrate how a combination of factors (different independent variables) predicts the behavior of a factor of interest (dependent variable). For example, if we want to predict the price of a house (dependent variable), we would build a model where location, size, and age would be independent variable.) Since I relied on R statistical software which is an open-source tool, I found many helpful R-codes online that allowed me to efficiently process many potential correlations at once and weed out the connections between independent variables that could potentially undermine the regression model.
experts_vs_people – When it comes to public policy decisions, whom do you tend to trust more: ordinary people, experts, or trust both the same?
1. Ordinary people, 2. The same, 3. Experts;
bus_pol_elites – “How well does the following statement describe your view? Most business and politics in this country are secretly controlled by the same few powerful people. 1. Not at all 2. Not very well 3. Somewhat well 4. Very well 5. Extremely well;
conspiracy_media – Much of what people hear in schools and the media are lies designed to keep people from learning the real truth about those in power.
1. Not at all 2. Not very well 3. Somewhat well 4. Very well 5. Extremely well;
vaccine_autism – Does most scientific evidence show vaccines cause autism or not?
1. Most scientific evidence shows childhood vaccines cause autism 2. Most scientific evidence shows childhood vaccines do not cause autism ;
corona_lab – Was the Coronavirus (COVID-19) developed intentionally in a lab or not.
1. The novel coronavirus (COVID-19) was developed intentionally in a lab; 2. The novel coronavirus (COVID-19) was not developed intentionally in a lab
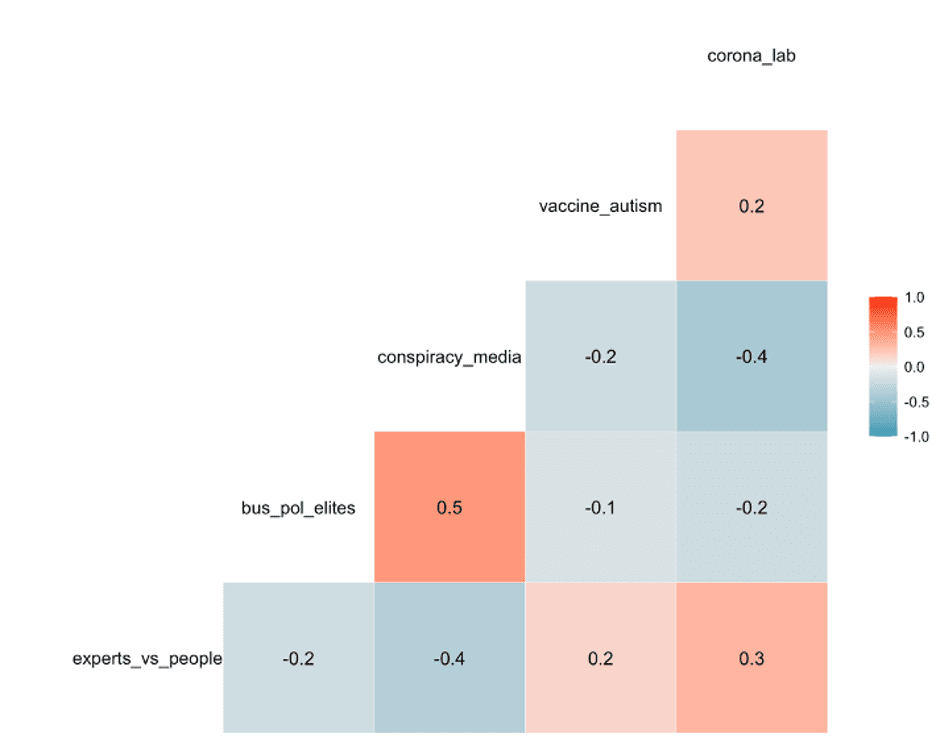
The table above is a visualization of correlations between the variables that capture the conspiratorial mindset. The R-code that produced this graph allowed me to quickly note that, for instance, there is a weak correlation between the variable that measured respondents’ answers to the question of whether they thought COVID vaccines were linked to autism (vaccine_autism on top) and the question that asked them about the degree to which they believed coronavirus was developed in a lab as a biological weapon (coron_lab). The color of the correlation square showed whether it was positive (red) or negative (blue), and any correlation above 0.7 typically means that the variables are almost interchangeable, closely correlated and move in tandem, which could, in a regression model, inflate the degree to which the rest of the independent variables are correlated with a dependent variable of interest. Lower degrees of correlation, such as the one between vaccine_autism and coron_lab (0.2) suggest that the answers to the questions that each variable measured are weakly connected, without any discernible pattern. I conducted a series of similar correlation matrices for each set of my independent variables to make sure that, for instance, answers on economic anxiety were not closely correlated. Though this stage of data analysis was primarily of an exploratory nature, it nevertheless familiarized me with the dataset more, which is an added benefit of conducting routine correlation checks.
The final stage of my project was regression model building during which I regressed each set of independent variables on separate conspiracy-theory related dependent variables. Since I had to conduct different regression models and weed out weaker independent variables, I used another R-code that allows you to visualize the results and immediately capture the patterns. R’s dotwhisker package visualizes the results of multiple regression models and shows which variable has the strongest impact on the dependent variable. By visualizing the results of different regression models that featured different sets of independent variables, namely the regression models that featured separately economic anxiety variables, political ideology variables, social cohesion variables and institutional mistrust variables, I could immediately tell which variables in each set had the strongest impact on the conspiratorial mindset variables. Since each set had variables that were measured along similar scales (typically, within a 1 to 5 range), the results were comparable and, thus, I could easily eliminate weaker independent variables.
party – Generally speaking, do you think of yourself as a… 1. Republican 2. Independent and Other 3. Democrat
ideo_pref – In general, do you think of yourself as… 1.Extremely conservative 2.Conservative 3.Slightly conservative 4.Moderate, middle of the road 5.Slightly liberal 6.Liberal 7.Extremely liberal;
trump_covid – Do you approve or disapprove of the way President Trump is handling the coronavirus (COVID-19) outbreak? 1. Strongly approve 2. Approve 3.Neither approve nor disapprove 4. Disapprove 5. Strongly disapprove;
voted_in_16 – Who did you support in the 2016 U.S. presidential election? 1. Donald Trump (Republican) 2. Other 3. Hillary Clinton (Democrat)
We’d like to get your feelings towards different groups on a scale of 0 to 100, which we call a “feeling thermometer.” On this feeling thermometer scale, ratings between 0 and 49 degrees mean that you feel unfavorable and cold (with 0 being the most unfavorable/coldest). Ratings between 51 and 100 degrees mean that you feel favorable and warm (with 100 being the most favorable/warmest). A rating of 50 means you have no feelings one way or the other. How would you rate each of the following groups?
feel_repub – Republicans
feel_black_people – Black people
feel_trump_supporters – Trump supporters
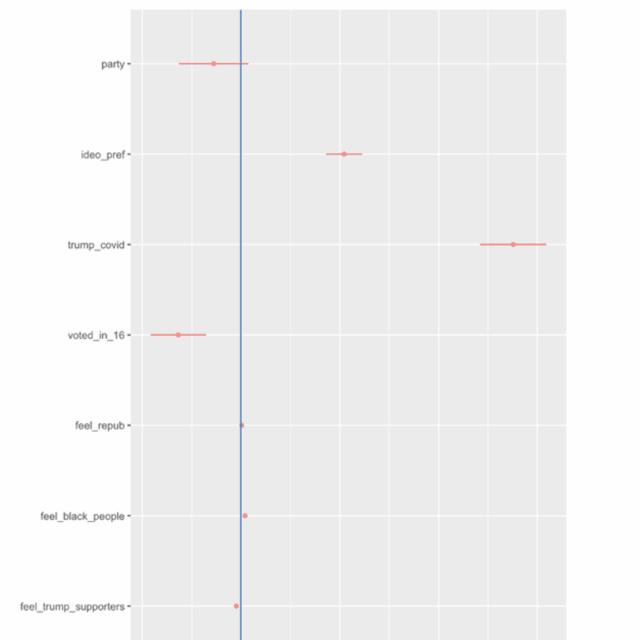
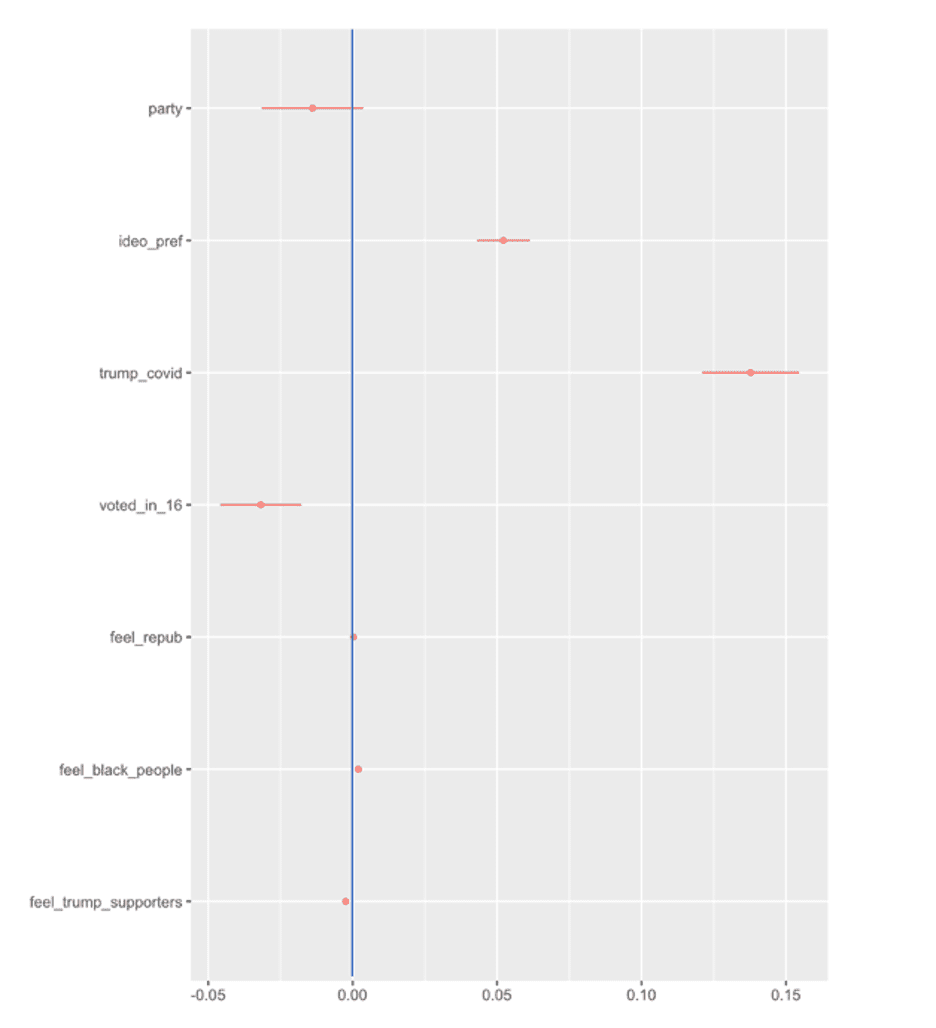
The table above visualizes the results of a regression analysis where answers to the question about the conspiracy theory of coronavirus being a biological weapon was my dependent variable and political ideology variables (shown on the y-axis) were independent variables. The further away the variable is from 0, the weaker its effect on the dependent variable. In this regression model, trump_covid, which measured the degree to which the respondent was confident that President Trump could handle the pandemic, was the strongest predictor. After selecting the most promising independent variables from each set, I built a meta model which featured the strongest independent variables.
Among the many interesting results that the project yielded, the strongest meta model with an adjusted R-squared of 0.6 had a non-COVID related conspiracy theory variable. The dependent variable in that model was Trump_vote_count which was the variable that measured the respondents’ answer to the question of whether they thought that if the 2020 votes were counted fairly President Trump would have won the reelection. Though the question is political, it does have the elements of a conspiracy theory. I decided to utilize this variable and treat it as one of my conspiratorial mindset dependent variables. The results were very interesting since it appears that respondents who were concerned about the state of their finances during COVID, who mistrusted mainstream news media and the CDC, and who voted for Trump in 2020 were more likely to believe in the election fraud conspiracy theory of the 2020 Presidential election. This meta model showed the strongest, most promising results. Of all the models that featured conspiracy theories as dependent variables, the model that featured a non-COVID related conspiracy theory turned out to be the strongest. It seems to be the case that hyper-partisanship is a potent force behind conspiracy theories. When it comes to exploring the factors that explain the conspiratorial mindset, political ideologies deserve to be given more attention from the researchers.
Survey results are by no means the ultimate answer to any research question. The wording of a survey question, sample selection (online or via phone) and an almost infinite number of other factors can affect the type of responses researchers get. Moreover, the survey that my NULab project was based on was conducted in the context of an ongoing global pandemic, which may or may not have influenced the results. The results that my project yielded are not definitive but just like any scientific endeavor invite discussion and debates, both of which I would more than welcome. Is there a better way to measure social cohesion and mistrust in government? Did I overlook another set of factors that could have altered the strength of regression models I built? I am excited to address these and other questions going forward, especially, now since I am much more confident in my statistical analysis and visualization skills.
Sources:
Allesina, Gianluca. 2018. “Fringe Groups and Their Beliefs in Conspiracies.” Student Scholar Symposium Abstracts and Posters, December. https://digitalcommons.chapman.edu/cusrd_abstracts/289.
Bergmann, Eirikur. 2018. Conspiracy & Populism: The Politics of Misinformation. Cham: Springer International Publishing. https://doi.org/10.1007/978-3-319-90359-0.
Bilewicz, Michal, Marta Witkowska, Myrto Pantazi, Theofilos Gkinopoulos, and Olivier Klein. 2019. “Traumatic Rift: How Conspiracy Beliefs Undermine Cohesion After Societal Trauma?” Europe’s Journal of Psychology 15 (1): 82–93. https://doi.org/10.5964/ejop.v15i1.1699.
Bracewell, Lorna. 2021. “Gender, Populism, and the QAnon Conspiracy Movement.” Frontiers in Sociology 5 (January): 615727. https://doi.org/10.3389/fsoc.2020.615727.
Lewandowsky, Stephan, Gilles E. Gignac, and Klaus Oberauer. 2013. “The Role of Conspiracist Ideation and Worldviews in Predicting Rejection of Science.” PLOS ONE 8 (10): e75637. https://doi.org/10.1371/journal.pone.0075637.
Prooijen, Jan-Willem van, and Karen M Douglas. 2017. “Conspiracy Theories as Part of History: The Role of Societal Crisis Situations.” Memory Studies 10 (3): 323–33. https://doi.org/10.1177/1750698017701615.
Simione, Luca, Monia Vagni, Camilla Gnagnarella, Giuseppe Bersani, and Daniela Pajardi. 2021. “Mistrust and Beliefs in Conspiracy Theories Differently Mediate the Effects of Psychological Factors on Propensity for COVID-19 Vaccine.” Frontiers in Psychology 12: 683684. https://doi.org/10.3389/fpsyg.2021.683684.
