For my NULab research project, I worked with the Women Writers Project at Northeastern. My overall goal was to add more context to a WWO text by providing map visualization to accompany a travel narrative. Before I could start on this project, I first had to learn text encoding using XML and TEI in Oxygen. I was embedded into the WWP as a text encoder, and fully encoded a text of my own before I began learning how to use XPath to create data that could be transformed into maps. The text I encoded was Helen Maria William’s Peru: A Poem in Six Cantos. After learning the standards of TEI markup that the WWP uses, I turned to learning about XPath. XPath allows you to search the markup and see patterns in the text(s) that would be less clear to a human viewer.
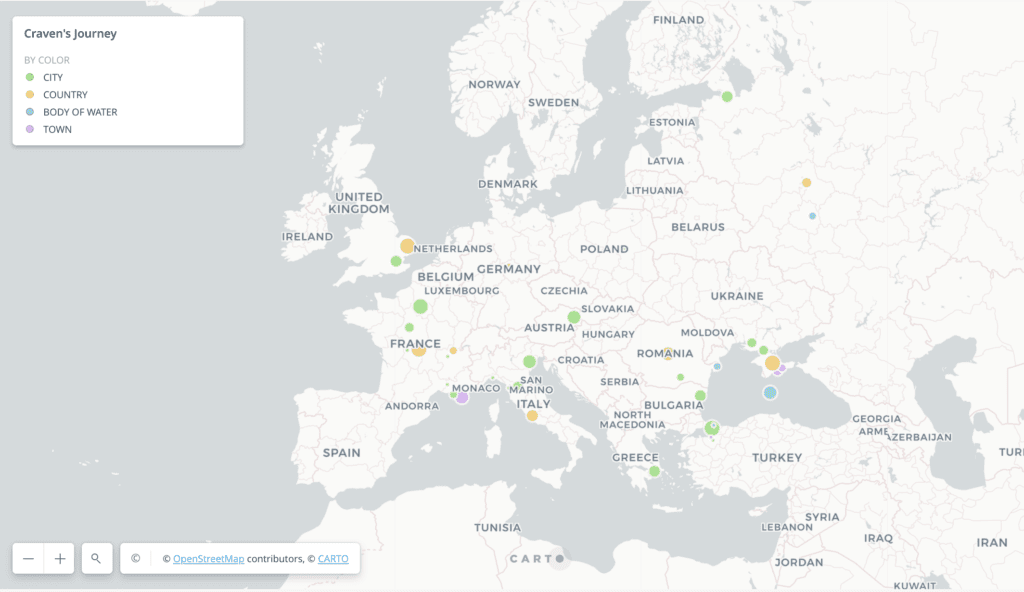
I chose to focus on Elizabeth Craven’s A Journey through the Crimea to Constantinople as the source text for my mapping visualizations, because it has a strong geographic focus. This text was already published in Women Writers Online (WWO). The text was originally published in 1789, and is a series of letters written by Lady Elizabeth Craven to her brother, His Serene Highness The Margrave of Brandebourg, Anspach, and Bareith, as she travels through Europe. Many of the <placeName>s in this text come from datelines in the letters where she notes when and where she is writing the letter. The very first letter begins with the dateline: “Paris, June 15, 1785.” I used XPath and the “Counting Robot” XQuery (created by Ash Clark) to create the data set of all of the <placeName>s within the text, with the corresponding number of mentions. I then took this information and imported it into a CSV format and added the necessary geographical information (latitude and longitude). I decided that it would be useful to categorize the <placeName>s by their type, which I separated into City, Town, Body of Water, and Country. I then used this newly created data set to create a map using CARTO. This map reveals all of the <placeName>s within Craven’s text that are mentioned at least five times. Constantinople is the most mentioned <placeName> within the text, being mentioned 46 times. I chose five as the lowest number of mentions to visualize for two reasons—I determined that five mentions reflected a meaningful number of mentions and it allowed for a manageable scope of data that would produce a readable map. The size of the dots roughly corresponds to the number of mentions. The markers are also color coded by type, with blue representing body of water, yellow as country, green as city, and purple as town. Hovering over a map marker will produce a pop up with the name of the place, as well as the type. This map allows you to get a visual indication of the geographic scope of the text, and reveals what areas are particularly central to the narrative. By categorizing the <placeName>s by type, the map demonstrates the diversity of what was considered a <placeName> by the encoder(s) who worked on the text. A screenshot of this map is included below.
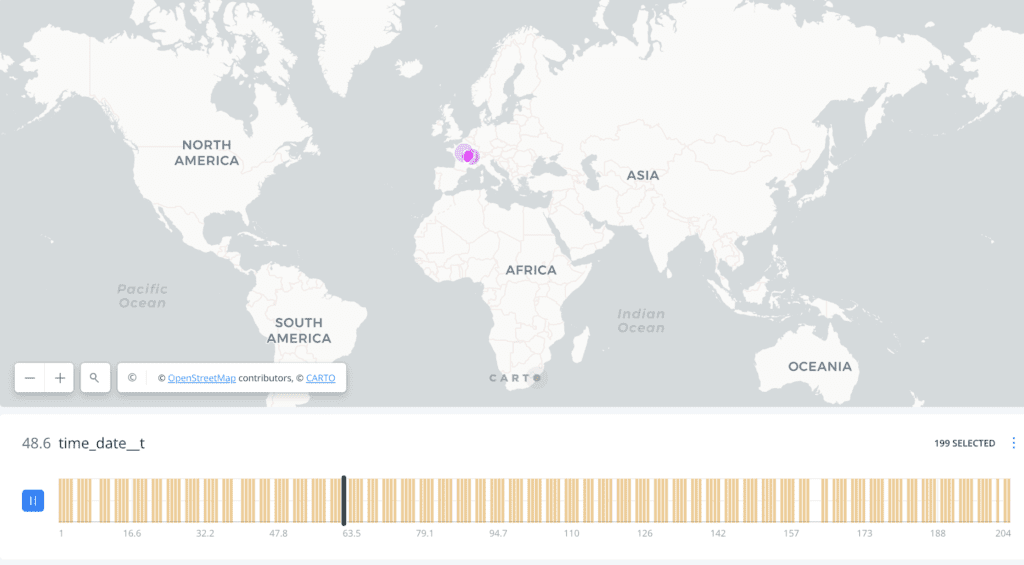
After creating this visualization, I became interested in representing the trajectory of Craven’s journey. To do so, I used XPath to aggregate a list of all of the <placeName>s in order of mentions in the text. I then had to do some data cleaning similar to the data set made using the “counting robot.” Specifically, Craven’s text used long esses (ſ) which I regularized into the ‘s’ character. There were 1,043 uses of the <placeName> element in the text. For the purpose of this project, I chose to identity the first 200 mentions and create a data set that could be used in a mapping context. I focused on the first 200 mentions for a scope that was manageable to complete in the timeframe of this semester. This decision meant that the maps created from this dataset reflect earlier parts of Craven’s journey. It would be interesting to create a data set of the last 200 mentions and compare it to these maps. Craven spends the early portions of her journey traveling around France; she begins in Paris and travels around France before making her way to Italy on her journey East. The first 200 mentioned <placeName>s end with Craven in Venice in November of 1785 and her entire journey concludes in Vienna in August of 1786. I took this data and entered it in CSV format, then repeated the process described above of ascertaining the geographical information (coordinates) of these locations.
Some of the place names in the ordered set required looking back into the text and reading the context. For example, the place name “Biscayne-bay” is not referring to the beach in Florida but rather the Bay of Biscay off the coast of Spain. Similarly, “Arsenal” is not referring to the football stadium in England, but rather the Venice Arsenal, which is an armory and shipyard within Venice. A list of all of the place names that required going back into the original text to determine their location is included below.
- Fillegara was determined to be referring to Phlegraean Fields outside of Naples in Italy
- Cashins was determined to be referring to Le Cascine market in Florence, Italy
- Tribune was determined to be referring to Tribuna of the Uffizi in Florence
- Campo Santo was determined to be referring to Camposanto the graveyard in Pisa
- Leghorn was determined to be an alternate spelling of Livorno, Italy
- Marlborough refers to Marlborough, Wiltshire
- Moncobron was determined to be referring to Montbron, France
- Cadix refers to Cadiz, Spain
- Portecroix was determined to be referring to Port Sanite-Croix
- Londres come from a passage entirely in French, is the French word for London
- Buxancely was determined to be Les Baux-de-Provence—this was in context of a list of small towns and villages (communes) in France
- Lillebouchar refers to L’Île-Bouchard
- Bretagne was determined to be an alternate spelling of Brittany
- Royal in context of the text refers to the Chateau Royal de Blois in France
- Bareith was determined to be Bayreuth in Germany
Much like encoding, this process required me to continually consult the original text. Unlike with encoding, the ‘original text’ I was going back to was the encoded version available through WWO and on Oxygen, as opposed to the original facsimile.
After creating a new data set of the first 200 place names in order of mention, I decided to make two separate maps to convey this data. The first map is animated, and demonstrates the movement of Craven throughout the first part of her journey. This was achieved using CARTO’s ‘animate’ feature, which can demonstrate trajectory as long as the data set is ordered. My data set included a column “order” that was numbered 1-200. One important thing to note is that oftentimes place names are mentioned in the text as references or description, therefore the map does not depict the trajectory of the journey but rather the trajectory of Craven’s narrative in terms of which places are mentioned. This first map shows a wide view of the movement throughout the text, but was difficult to use to identify any specific places which led me to create a second map to accompany the first. A screenshot of the animated map of the first 200 mentioned place names in Craven’s text is below:
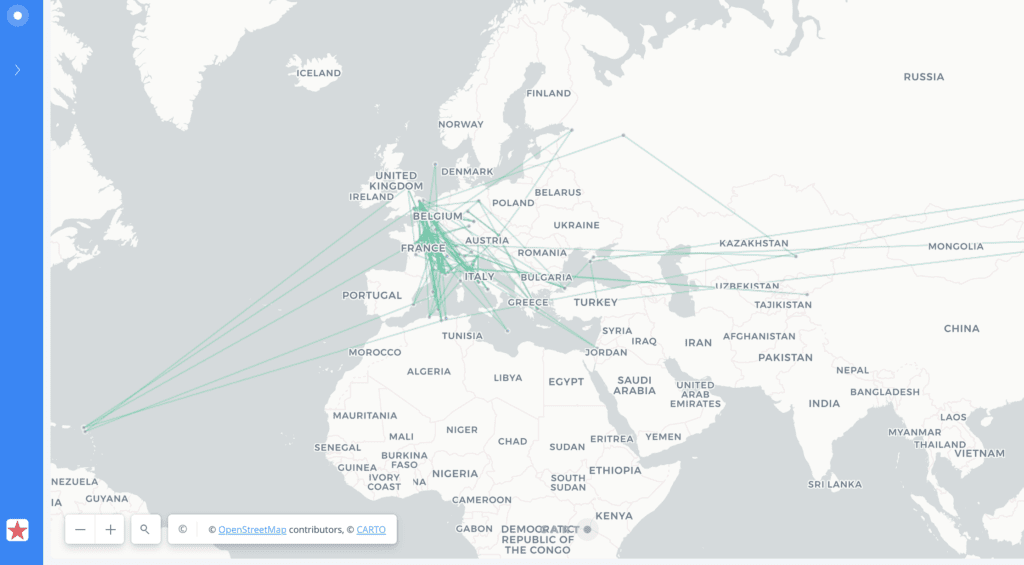
As an accompaniment to the first map, I used the exact same data set to create a second map. The second map includes a line of trajectory that connects all of the map markers. The line is reminiscent of a map of flight paths. On top of the line are small map markers that, when hovered over, display the name of each location, as well as its ordered number. I believe that these two maps together succeed in visualizing this trajectory. A screenshot of the second map is included below:
These maps are mostly exploratory, and serve to demonstrate the geographical possibilities that can be found within the WWO’s repository of texts. As an accompaniment to the text itself, these maps help to expand the understanding of the geography and to get a sense of the distance Craven actually traveled in her journey. It is also interesting seeing what is considered a <placeName> within a text, which this methodology allows you to highlight. In a larger iteration of this project, it could be useful to create a narrative StoryMap that highlights notable instances within the text. StoryMap offers the ability to include sections from the actual text alongside geographic visualizations, which could further connect the maps to the original text. It also would be interesting to potentially divide the texts into sections, and create maps of the trajectories through each section. It was rewarding to have the ability to combine multiple digital humanities skills that I have developed throughout my time with the NULab. I first familiarized myself with mapping tools during DH Graduate Certificate for my project “Visualizing French Muslims”, which I completed from 2017-2019. Working with the NULab as the Principal Coordinator this year allowed me the resources to familiarize myself with text encoding, and the possibilities of using XPath for research on already encoded texts.
