By Hanyu Chwe
As part of GIS Day 2018, the Digital Scholarship Group, the Northeastern University Visualization Consortium (NUVis), and the College of Arts, Media and Design brought Nil Tuzcu and Arzu Çöltekin to present on mapping and visualization.
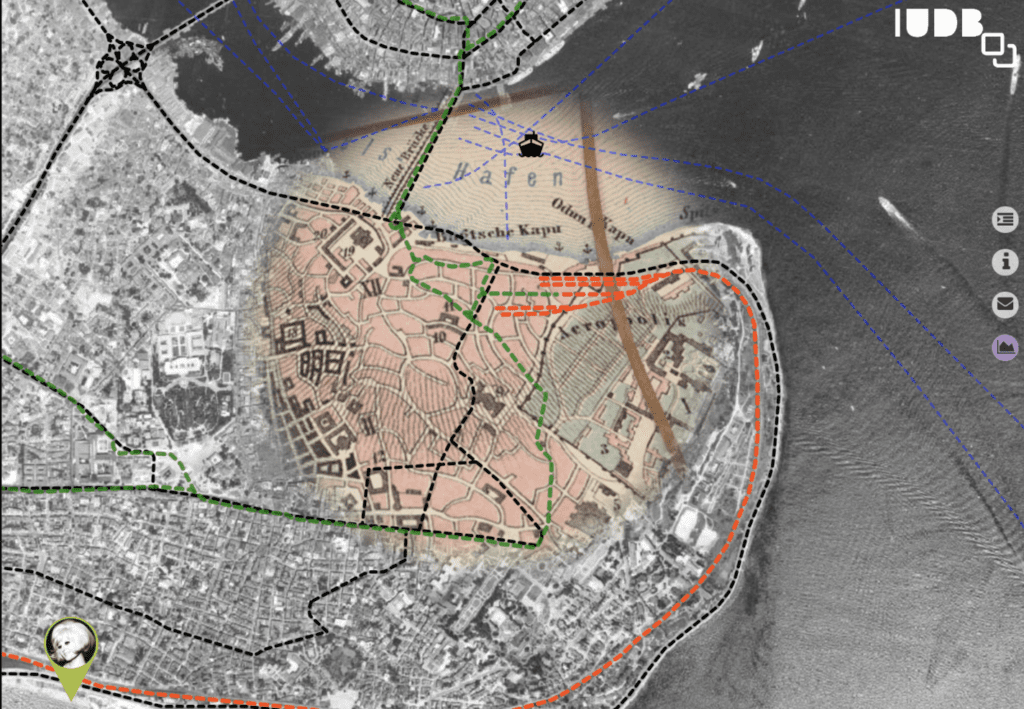
Nil Tuzcu is an information designer and urban technologist specializing in spatial data analysis and visualization at the Center for International Development at Harvard Kennedy School. Tuzcu started by describing the Istanbul Urban Database, an interactive deep mapping project that lets visitors explore Istanbul throughout the decades. Users of the database can compare different city maps from throughout Istanbul’s history, trace historic ferry and train routes, and view cultural hotspots like beaches or casinos.

Tuzcu’s second project, “I am Istanbul”, follows fictional characters as they go about their day in Istanbul. This interactive web experience combines archival photos, videos, soundscapes, and data visualizations. Viewers use the maps stored in the Istanbul Urban Database to track a character’s route. The end product offers viewers a chance to immerse themselves in the social, political, and geographical changes transforming 20th-century Istanbul.
The third feature, “September 1955”, is a virtual-reality documentary that Tuzcu developed with Cagri Hakan Zaman and Deniz Tortum to memorialize the Istanbul Pogrom, a series of government-led mob attacks on Greek minorities. Visitors can don a VR headset and step into the shoes of a local merchant who owns a photo studio. Through the headset, visitors watch both the attacks and the aftermath of the violence on Istanbul’s streets. In the larger installation, Tuzcu combined the virtual experience with photographs on the walls of the installation. By combining physical and virtual media, the installation immerses viewers into a tumultuous moment in Istanbul’s history.
Dr. Arzu Çöltekin is a Research Group Leader and a Senior Lecturer at the Geographic Information Visualization and Analysis group at the University of Zurich and a research affiliate at Harvard University. Her research is broadly about understanding how people process visual information so that designers can make better visualizations.
As Dr. Çöltekin explains, many factors influence the way we interact with visualizations. Viewers have differing cognitive, perceptual, and visual abilities, and contextual or task-related factors vary from situation to situation. For example, an ambulance driver approaches a traffic map much differently than a tourist planning a future vacation. Designers must tweak the variables in their visualizations to accommodate a wide variety of possible situations and users.
Here are just two topics that Dr. Çöltekin touched on in her presentation:
People tend to prefer maps that offer a surplus of geographical information, like satellite terrain maps, over simpler maps that are optimized to show relevant information, like basic road maps. Dr. Çöltekin and her team found that actually users recall routes more accurately when using abstract road maps, compared to more realistic satellite maps. Users are also more confident in their ability to recall routes when using abstract maps, despite their preference for realism.
As people get older, their spatial memories tend to get worse. Dr. Çöltekin and her team are investigating whether certain visualization environments could counter age-related decline in spatial perceptions. When comparing three different visual environments, (an abstract, realistic, and a mixed-environment) they found that participants could remember more routes in the mixed environment. Exposure to the mixed environment also mitigated high overconfidence levels in elderly participants—older participants were generally overconfident in their ability to recall routes.
Dr. Çöltekin touched on many other topics: testing the effect of shadows on terrain maps, personalizing user displays personalization, testing spatial abilities, and more. For more about her research, visit her website. For more about NULab events, be sure to visit our event page.


