
Introduction
Late in my NULab career, I was very happy to join a professor in the history department at Northeastern on a project to chart the changes over time of American military bases overseas. The project remains in its early stages, but the goal is to create a visualisation to present these changes from the end of the Second World War to the present. For my NULab research project, I took on the task of initial research, in the hope of creating a proof-of-concept product for how the final project might present and visualise the data we find, as well as a database to collect and wrangle it. The hard part has proved finding that data. What follows explains the frustrations of the quantitative research process, with some more optimistic suggestions for procuring qualitative data.
In order to show change over time, I had to consider the relevance of various categories or types of data against its availability. A key part of the project will be the material developments to bases, so any changes to expenditure, area size, the number of military and civilian employees or residents, and the hardware or equipment that was stored or used on the base were sure to be useful. Environmental data around climate, weather and pollution would also be valuable, although it is unlikely that this data was collected in the immediate aftermath of the Second World War. But a central focus of the historical literature around bases is how they are sites of contest. Because the aim here is not merely to crunch numbers, but also to include human stories around US overseas basing, any information from sources local to individual bases that chronicled local resistance movements would also inform the project, albeit in a different way than the material data points on bases. I imagine the proof-of-concept will be an ArcGIS StoryMap, since it will facilitate visualising geospatial data through its express maps, as well as incorporating all sorts of other media to tell the human stories.
Quantitative queries
While it is every researcher’s dream to find data relevant to their work neatly collected and published in an intelligible way, my hopes of finding an orderly dataset from the Department of Defense have been dashed. The best and most comprehensive accounts that include the data points listed above are the annual “Base Structure Reports” published by the Pentagon. However, they only exist for about the last thirty years—it’s actually not clear when they began—and are not archived by the DoD. Scouring various places on the internet, I’ve pieced together all the reports since 1991, along with a handful from the 1980s, but they are clearly insufficient to build a database for the postwar period.
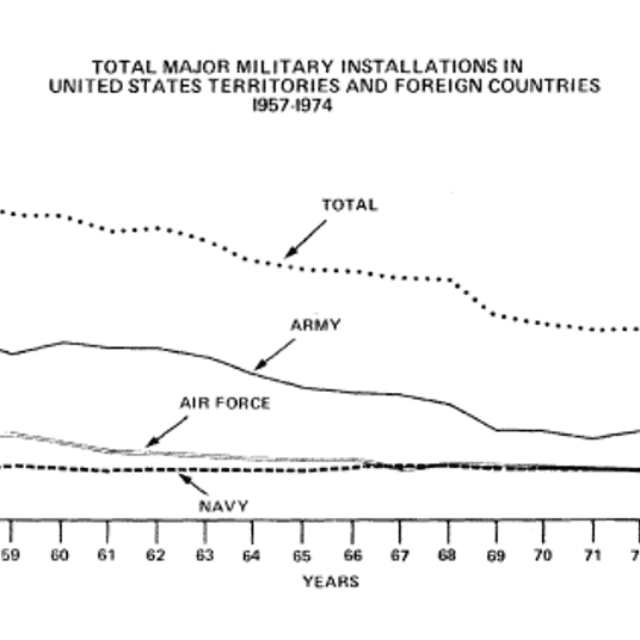
That is not to say that the data wasn’t collected by various government departments and agencies, as one report from the General Accounting Office from 1980 shows. In a submission to the Congressional Subcommittee on Military Construction and Stockpiles, the GAO presented figures and charts for domestic and foreign bases from the years 1957-1980, exemplifying a zoomed-out mode of the work I would like to undertake. (See Figure 1.)
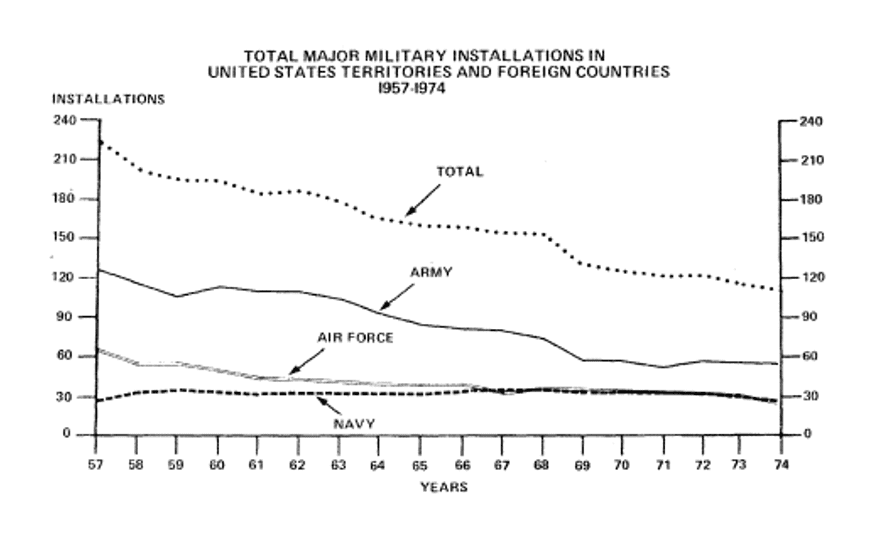
Figure 1: “Enclosure II,” “Changes in DOD’s Base Structure From 1957 to 1978 (LCD-80-104),” United States General Accounting Office, September 11, 1980.
Unfortunately, the GAO did not publish the data it used, nor did it account for how it was collected. In the submission to the committee, the author warned that the report contained summaries of data from “a variety of DOD sources,” and that the data’s accuracy hadn’t been verified due to time constraints. It’s heartening to know that researchers in the GAO in the 1980s faced the same struggles that I’ve encountered.
With no comprehensive collection of data, reverse engineering seemed to be the best course of action. However, even amalgamating data from different government sources has proved extremely tricky. The Defense Manpower Data Center collects data on military personnel, manpower, training, and financing—in many ways it serves human resources functions for the DoD—and it publishes monthly reports on these categories. Regrettably, its historical reports, which date back to the 1960s, only contain the total numbers of service personnel by rank, and include no information on where they were based. The DMDC does fulfil data requests… but only to DoD personnel.
Foregrounding expenditure is another route towards a better understanding of overseas military bases. Total defense expenditure figures are fairly easy to come by, as the Secretary of Defense makes regular statements on the defense budget appropriated by Congress. Historical data is available online from the Under Secretary of Defense (Comptroller), as is data on DOD contracts, but, again, this only goes back a few decades. The RAND Corporation has shown what kind of analysis can be done when spending data is combined with manpower and personnel figures, running regressions that estimate the relative costs of building and maintaining overseas bases relative domestic bases. However, the data used in the report is insufficient for historical analysis. Historical data from projects like Costs of War and the Global Campaign on Military Spending is similarly lean.
It seems like the search for quantitative data for this project will require on-site archival visits to NARA and the Library of Congress, and perhaps some FOIA requests. While this aspect of the research has been frustrating, the humanist, qualitative side has proved more fruitful. As above, the literature often focuses on bases as contested spaces, and attending this aspect of the project has proffered richer results.
Based bases
This attention does, however, require some cherry-picking. To exhibit a full account of the human stories around American military bases, it is necessary to zoom in and consider the individual spaces of particular bases, to make the project deeper, rather than broader. Since this is a proof-of-concept, I therefore decided to choose a single base and explore its history. Okinawa is the most famous example of a contested military base, but, as a student of the Anglo-American relationship, I wanted one based in the UK, and picked RAF Greenham Common in Berkshire, for no other reason than it’s near to where a member of my family lives.
Greenham Estate was requisitioned by the RAF in 1941, with the first USAAF forces arriving in September 1942. Since the Second World War, it has hosted various fighter groups and bombing groups, but most notably was the base that housed “Glick-ems” (ground-launched cruise missiles, or GLCMs) with thermonuclear warheads. The “Glick-ems” attracted a great deal of popular protest, some of which has already been chronicled by academics from various disciplines. The most salient protest came in the early 1980s, when Greenham Women’s Peace Camp—a powerful women’s anti-nuclear group—protested outside the base for several years.
The protests made national news, and as such there are a great deal of online sources to inform the project. Parliamentary debates about the base can be found on Hansard, the Campaign for Nuclear Disarmament and The Peace Museum have commemorated the protest, and The Guardian has published interviews with women who were there. There is also a trove of material at the National Archives in Kew that relates to the protest, its policing and the development of the site after it was decommissioned as a base.
Next steps
In the short term, making a StoryMap about RAF Greenham Common will be my priority. I’ve already started building one and experimenting with express maps, but I am keen to find some high-quality images of historical maps to use the swipe feature on ArcGIS. In the intermediate term, I need to think carefully about how to go about acquiring enough quantitative data to make the zoomed-out broader-not-deeper perspective feasible for the project, and consult my supervisor about the best way to proceed. As I begin to collect enough data to view both the broader and deeper perspectives, I will need to consider the relationship between them. John Stewart’s recent interview with Deputy Defense Secretary Kathleen Hicks exposed some of the gaps between military spending and the human experience of living and working on military bases, and I would very much like to pull on that thread historically.
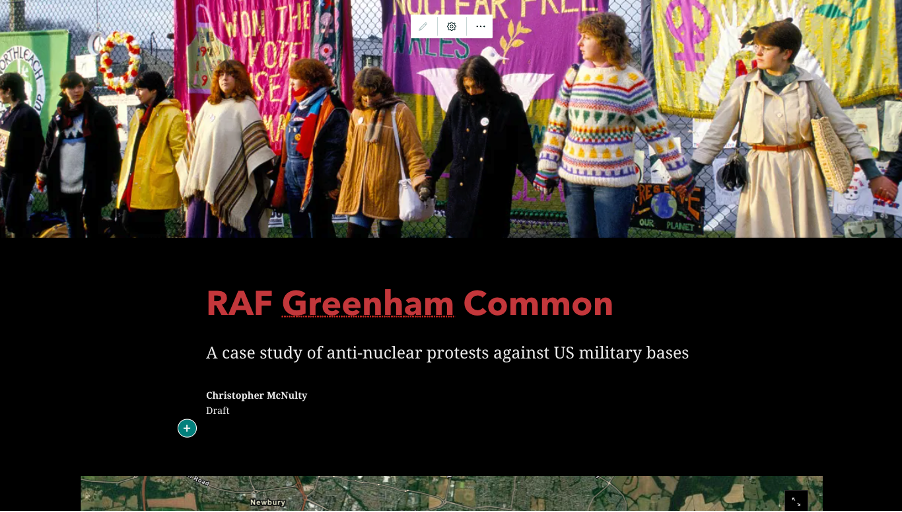
Figure 2: The beginning of the ArcGIS StoryMap.

