
A NULab-RDS Research Project by Vaishali Kushwaha
My doctoral dissertation, at the School of Public Policy and Urban Affairs, focuses on the planning, management, and governance of water in the context of Indian cities. My NULab Fellowship, 2021-2022, provided me the opportunity to learn and integrate digital skills with a project that intersects with my interests. I used this opportunity to collaborate with Bahare Sanaie-Movahed, the GIS and Geospatial Expert, at Research Data Services (RDS), Northeastern University Library, to create a water mapping project. In this research project I investigated the spatial and temporal evolution of water supply, key water resources, and infrastructure in Ahmedabad—a case study city in India.
Ahmedabad (Amdavad) is a typical Indian city which has rapidly urbanized, is prone to droughts and experiences extremely high levels of water stress (World Resources Institute, 2019b). With a population of more than 5.8 million and an extended population of 6.3 million, Ahmedabad is the largest City in the State of Gujarat and is the seventh-largest urban agglomeration in India (Census 2011, 2015). It is situated in a semi-arid landscape of North Gujarat where water is of paramount importance. Hence, the collection, preservation, and use of water has deeply influenced the City’s history, culture, and development. My research objective was to investigate (1) how did the City meet its water needs prior to the 20th century? (2) how does it currently meet its water needs? (3) how does the current water supply system differ from the traditional ways? Can we draw lessons from the past to make the future of Ahmedabad’s water supply system more equitable, efficient, and sustainable?
My hypothesis was that traditionally the City depended on rainwater and sourced water locally, however as the City grew and demand for water rose, it started importing water and became dependent on water sources far away from the city. I used primary data collected from field work and secondary data from literature review to study the evolution of water supply systems in the City of Ahmedabad. I used Esri ArcGIS Pro, a digital mapping tool, to test my hypothesis and analyze the locations of key water supply resources and infrastructures prior to the 20th century and at present. I then used Esri ArcGIS StoryMaps to combine the power of maps and multimedia with my research findings. I used the strength of Esri’s digital storytelling and mapping tools to produce an informative, interactive, and accessible WaterMap of Ahmedabad.
This project had three phases to it: (1) conducting research and collecting data/multimedia on the evolution of Ahmedabad’s water sources and water supply infrastructure; (2) creating digital web maps to chart the key water sources and water supply infrastructure in the pre 20th century era and the present time; and (3) creating the StoryMap that integrates my research findings, multimedia, and web maps.
Phase 1: Research and Data/Multimedia Collection
Finding easily accessible and reliable information is the most challenging part of working in a developing country. My experience of working in Ahmedabad, India, was no different. Learning about the City’s modern and current water resources management practices was relatively easy because some information was available on the City municipal corporation’s website and the rest I could collect during interviews and field visits. I had more than one source of information to triangulate the data and I was also able to visit some of the important sites, record observations and take photographs. However, learning about the traditional ways of water management was much more challenging. My NULab fellowship and research project started after my field work was completed and during COVID-19 travel restriction times. Researching traditional ways of water management was not part of my dissertation field work, hence I had to base this section of my research completely on secondary sources. There was negligible official information available from the City government; however I found a treasure trove of information in form of the “Stepwells of Ahmedabad – a conversation on water and heritage”—an ongoing, collaborative research initiative and traveling exhibition by a group of architects and experts from Ahmedabad. A short film, providing a virtual tour of selected Stepwells, was created as part of this initiative which was available on YouTube. I was also fortunate to find digitized versions of Kenneth L. Gillion’s 1969 book “Ahmedabad: A Study of Indian Urban History” published by the Australian National University Press, Canberra. Together these two sources formed the foundation for my understanding of traditional water management practices prior to the 20th century. Lastly, The British Library’s initiative to digitize images from out-of-copyright books and digital archives provided me with images of Ahmedabad and Sabarmati River from European travelers’ handbooks, from as far back as the 1890s and 1670s.
Phase 2: Creation of Digital Web Maps
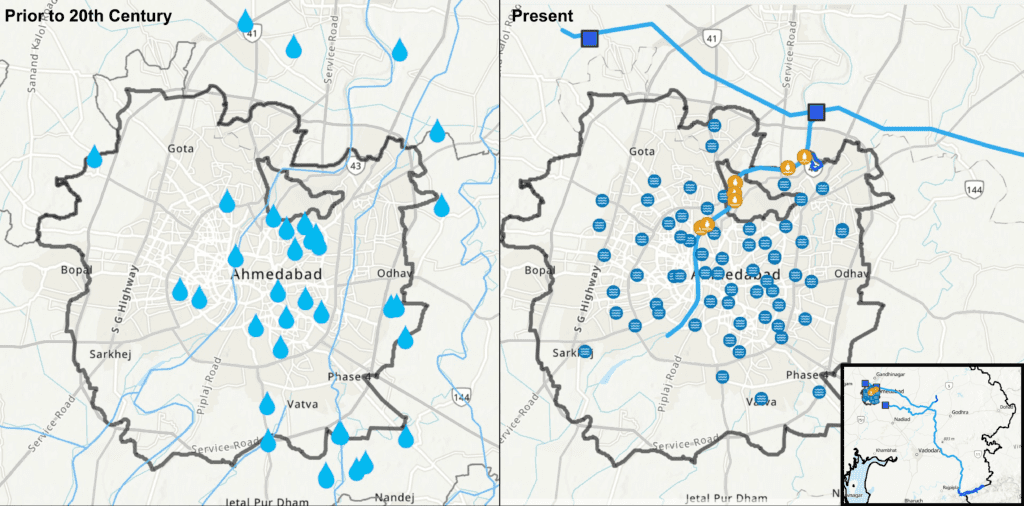
In the second phase I conducted a review of India-specific GIS databases and was able to find GIS data and layers for administrative boundaries and natural waterways. However, Ahmedabad-specific manmade water infrastructure layers were nonexistent. Hence, after consulting Bahare Sanaie-Movahed, I decided to create original layers and maps to chart the location of key water sources and water supply infrastructure. This task required me to gain proficiency in ArcGIS Pro software and its online counterpart. I also collected the location and geographical coordinates of key water sources and infrastructure. I used the information on the Amdavad Municipal Corporation website, data collected during the fieldwork, and validated it using Google Map satellite images to find geo coordinates of the present day infrastructure. I created multiple layers to distinguish between the different types of water sources. For example, the bulk water imports from the far away Narmada and Mahi River comprise a single layer. The subsurface water extraction from the local Sabarmati River comprises the second layer, and the groundwater extraction at ward-level distribution centers created the third layer. For building the old infrastructure web map, I borrowed the list of thirty-seven (37) protected and other stepwells in and around Ahmedabad from the Urban Management Center’s 2018 book “Lesser Known Stepwells”. Their coordinates were determined using Google Map satellite images. I extracted the geographical data for manmade lakes from the pre 20th century using Google Map satellite images.
I created two digital maps for this research project: the first one depicts the pre 20th Century water supply sources and infrastructure map showing the locations of Sabarmati River, Kankaria and Candola lakes, and 37 Stepwells in and around the Ahmedabad city. The second one depicts the current municipal water supply sources and infrastructure map showing location of Sardar Sarovar dam and canal, Mahi River dam, 3 intake and water treatment plants, sub-surface water intake wells at Sabarmati River, and 62 ward offices/main water distribution hubs.
[Created using ArcGIS Pro; Available for public use]
Phase 3: Creation of StoryMap
The last and final stage of the project was to weave the research findings, multimedia collection, and web maps in a StoryMap. I chose to use Esri ArcGIS StoryMap tool because it was compatible with my ArcGIS based web maps. Moreover, it offered me the flexibility of using a variety of content and multiple ways to share media and create immersive experiences. It also offers attractive themes, navigation bars, and mobile friendly design.
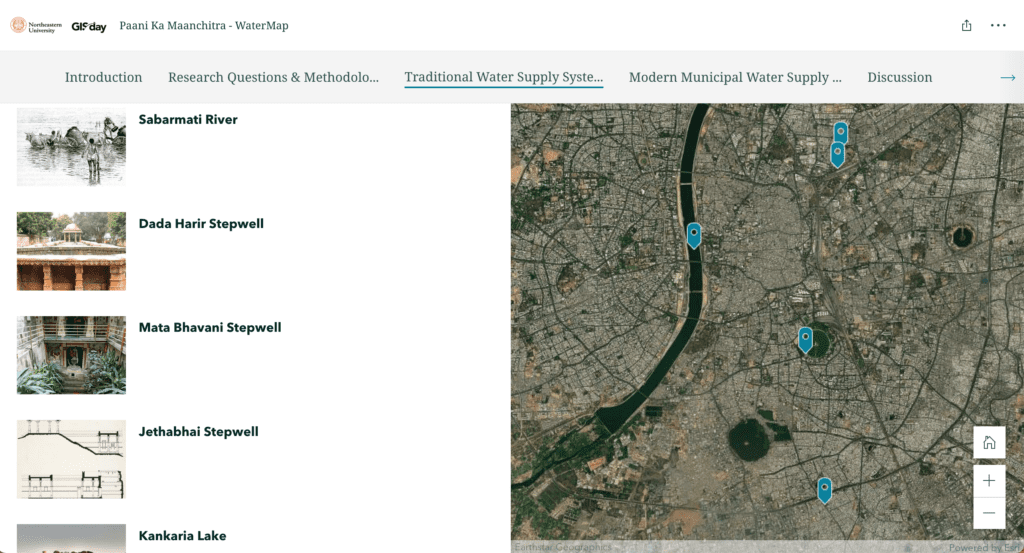
In my StoryMap I have used web maps, images, image galleries, video, and swipe tools for showcasing different media. I found the swipe tool to be a very effective choice to compare before and after images and show the transformation from old to new. The swipe tool lets viewers use an interactive slider to compare two maps or images. I also used sidecar and map tour options to make the StoryMap more interactive. Sidecar is an immersive block with a stationary media panel and scrolling narrative panel. Lastly, the map tour is potentially the most impressive and impactful block of ArcGIS StoryMap. It let me create a virtual tour of the key water infrastructure locations which the users can explore in any order. I created two map tours, one for the traditional water supply system and another for the present day municipal water supply system.
I am calling the StoryMap that I created for this project “WaterMap”, and it is available here. This WaterMap is an important contribution to the emerging field of urban water management in India. It is a distinctive study that combines academic research with digital tools to make the outcomes interesting, interactive, and viewer-friendly. Moreover, readily available, processed, and free GIS data on India is very limited. The GIS data and web maps that I created in this project are for public use, thereby contributing unique, processed and open data on India to the GIS community.
Moving forward, I envision transforming this WaterMap project into a crowd sourced database initiative wherein people can explore the water resources and infrastructure in the city of their interest and create a WaterMap. I plan to extend my collaboration with NULab and RDS to create a workshop module focusing on the topic of urban water management and digital mapping/storytelling tools. I have three potential modes through which I plan to disseminate WaterMap knowledge and seek community participation: (1) Make the workshop material freely available so that people who are interested can self-learn then create their own WaterMaps. (2) Partner with faculty across environmental planning and policy schools who can use this module as an assignment for their classes. (3) Collaborate with Northeastern’s GIS Day celebration and host a workshop on creating WaterMaps. My hope is that with this initiative I can encourage people to explore and build connections with water resources within their own communities; understand the water crisis and challenges they may face; and in the process collectively build a knowledge base of urban water practices from which everyone can learn.
Acknowledgements
Special thanks to K.J. Rawson, Associate Professor of English and Women’s, Gender and Sexuality Studies; Coordinator of Digital Integration Teaching Initiative, and Sarah Connell, Assistant Director, NULab for Texts, Maps, and Networks & Women Writers Project, for giving me the opportunity to develop a research project close to my heart. Your feedback on StoryMap and Blog improved the quality of my work multifold. This NULab/RDS research collaboration project would not have been possible without Bahare Sanaie-Movahed, Geospatial & GIS Specialist. Thank you for mentoring me through the mapping process. Learning Esri’s ArcGIS tools, finding relevant databases, and overcoming technical difficulties would have been impossible without you!
References
Census 2011. (2015). Urban Agglomerations Census 2011. Accessed 12/18/18.
Water Resource Institute. (2019a). “Aqueduct 3.0 Country Ranking.” https://www.wri.org/data/aqueduct-30-country-rankings.
World Resources Institute. (2019b). Aqueduct Water Risk Atlas. Accessed 3/19/22.
United Nations, Department of Economic and Social Affairs, Population Division. (2018). “World Urbanization Prospects: The 2018 Revision – Key Facts.” accessed 11/5/2021. https://population.un.org/wup/Publications/Files/WUP2018-KeyFacts.pdf.
