Jojn us for “Sourcing Boston,” a hackathon where participants will explore data to tell compelling stories and draw insights about food insecurity, economic disruption and resilience.
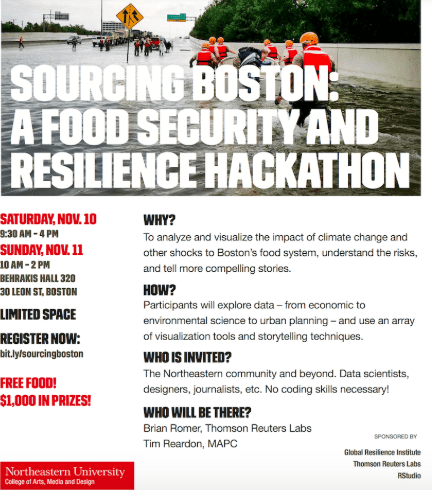
Visualizing the impact of climate change and other shocks to Boston’s food system
How stable and just is Boston’s food system? What does it look like, in size and complexity?
On the weekend of November 10th and 11, Northeastern University’s College of Arts, Media and Design and the Global Resilience Institute will host “Sourcing Boston,” a hackathon where participants will explore data – from economic to environmental science to urban planning – to tell compelling stories and draw insights about food insecurity, economic disruption and resilience.
In partnership with Thomson Reuters Labs and RStudio, this event will challenge participants to leverage data, analytics and visualization to find new ways of telling stories and deriving insights about how climate change and other shocks can disrupt food systems, supply chains and basic infrastructure in Boston.
Who can sign up and who will be there?
The event is open to both students from Northeastern and greater Boston, as well as professionals from any field. It will be kicked off with lightning talks on resilience data, and visualizing and communicating risk.
What kind of stories are we looking for?
– Identify current food deserts and predict where new ones might be emerging in Boston
– Visualize the web of food imports by land, sea or air into New England
– Design a contingency plan for food and other supplies in a post-disaster Boston
– Integrate social media and government data to paint a picture of food insecurity in the region
– Analyze Boston’s food infrastructure to predict where it might fail first in the event of a disaster
What kind of datasets will be available?
– Massachusetts agricultural census data
– NASA Earth Observatory data
– Boston food access data
– Curated food riot data 2007-2016*
– NOAA sea level rise data, FEMA flood risk data, NASA historic sea levels data
– U.S. Census food security questionnaire data
– Media coverage of food security stories
– Many more!
*Data provided exclusively by Thomson Reuters Labs
What tools will be at your disposal?
– Whatever you’re comfortable working with
– RStudio and RShiny for data analysis and visualization
– Knight Lab digital storytelling tools
– LeafletJS, Datawrapper and Carto.com for mapping
How will projects be judged?
A panel of Northeastern professors and industry experts will judge projects on the following criteria:
Clarity: Does the project make sense and communicate well? Is it easy to understand, use and gain insight from?
Accuracy: Are the data correctly sourced, well-curated and well cleaned? Can we trace the sources back to verify the results?
Interesting Research Question and Analytic Value: Can you provide data-driven answers which are hard to get elsewhere?
Aesthetics: Is it beautiful and a joy to use?
Extensibility: Could this be extended and/or incorporated into a larger system?
What are the prizes?
$1,000 in prizes.