On October 31st, the NULab hosted its annual Speed Data-ing Event, designed to bring researchers and data sets together and help researchers think of new ways to use their data. Professors from multiple departments presented data sets and tools for working with them. A diverse array of projects were presented in lightning talks: “Bringing Domain Knowledge Back to Topic Models Through Anchor Words,” by Ryan Gallagher; a database of 19th-century census info by Cameron Blevins; “The Early Caribbean Digital Archive” by Alanna Price and Liz Polcha; “Her Truth: Analyzing the Editorials of Nackey Scripps Loeb” by Meg Heckman; “Criminal Interrogations: Digitized” by Jessica Sibley; and “What Do Organizations Do? Organizational Form in a Social Movement Sector” by Laura Nelson. Each presenter and project came with an interest in collaboration or advice, and while many received helpful feedback, if you feel there is something you could contribute after reading, please feel free to reach out to nulab [dot] info [at] gmail [dot] com.
Ryan Gallagher’s talk focused on allowing users to pick anchor words for topic models to help with automated analytic tasks like document classification and machine learning. A user can pick an anchor word such as “protest,” and the software can then create a network of related topics for the user based on a textual data set – for instance, “social justice,” “riot,” “strike,” for the anchor word “protest.” Said topics could themselves be based on more than a single term, for example, “black lives matter,” and “race” could be associated with “social justice” under the “protest” anchor word. Gallagher’s tools are available, and he is interested in helping whomever in the humanities would be interested in using them.
Professor Cameron Blevins presented a data set composed of thorough census information from Logan Precinct in the 19th Century. The data set is unique for how thoroughly it details the people it describes; researchers can determine not only the size, age, and gender makeup of households, but their relative proximity to each other through the household numbering system the list is organized by. Alanna Price and Liz Polcha also presented a historically oriented data set, the Early Caribbean Digital Archive, which recently had published an archival set of Caribbean texts, and emphasized that tools would available in the near future to educators wishing to teach said texts they had made available.
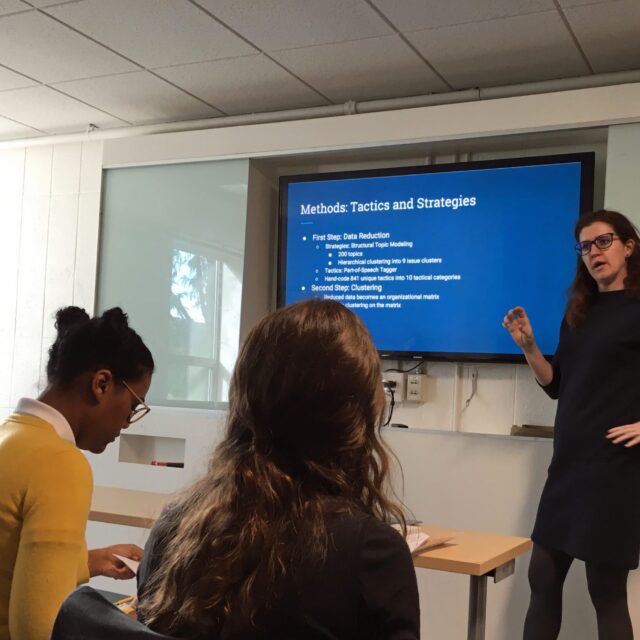
Professor Meg Heckman presented a data set of the editorials of Nackey Scripps Loeb in the Manchester Union Leader, a disproportionately influential newspaper in US presidential elections. One challenge of the data is that it is printed on microfilm, and is vast in size, but an analysis of the data could be invaluable in unpacking the influence of this female publisher. Also dealing with social impact data is Professor Laura Nelson, whose study of how cooperative actions by social interest groups function in societal change has recently been wrangling a data set of thousands of articles and organizations. The data has begun to be analyzed, but Professor Nelson said that she could use help figuring out how to best visualize it.
Lastly, Professor Jessica Sibley presented a data set of videos of criminal interrogations. Her research focuses on how the structure and craft-work of these videos of interrogations can influence whether the accused is seen as guilty or innocent. She is currently searching for a visual image processing tool that would allow for the large collection of videos to be computationally analyzed, and a manner to ensure that the data and results of analysis are used in a socially responsible manner.
If you have any leads for these promising projects or are interested in getting involved with any of these researchers, please reach out to nulab [dot] info [at] gmail [dot] com.


