In our second report drawn from the Living in Boston During COVID survey, we have focused on contrasting themes of fear and ambivalence among Bostonians. On the one hand, there appears to be broad consensus that the virus is dangerous, that social distancing guidelines are important, about wearing masks and avoiding high-risk activities, and that asymptomatic spread is a concern. However, the proportion of respondents who differed on these views is non-trivial and varies substantially by neighborhood, race, and income. These variations can help us to understand the vulnerabilities that different communities face as cases surge this winter. In today’s data story, the second of four from this report, we focus in on high-risk behaviors.
Our survey measured high-risk behaviors by asking people the frequency with which they participated in 4 forms of socialization that have been highlighted as the riskiest for infection exposure: visiting in other people’s homes, attending gatherings of 10 or more people, and frequenting restaurants and bars. We asked how often they did so on the average week in April and for the previous 7 days (in the Summer).
As we see in Figure 1, nearly 70% of people said they engaged in none of these behaviors during April. Unsurprisingly, as the Commonwealth “opened up” in the Summer, this proportion dropped substantially to just over 30%. To illustrate, the proportion of respondents who visited in someone else’s home in the previous week or had someone else visit in theirs increased from 31% in April to 55% in the Summer; the proportion of people who said they had attended a gathering of 10 or more people in the last seven days increased from 4% to 19%; and the proportion of people who had visited a restaurant, bar, or club increased from 4% to 35%.
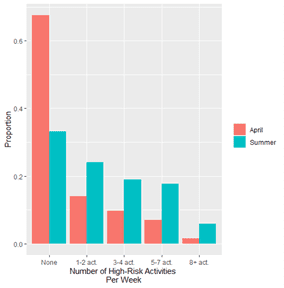
Figure 1. Number of high-risk activities per week across respondents, in April and in Summer.
Focusing then on Summer, we see substantial differences in these behaviors across neighborhoods and populations. These differences largely mirrored the distribution of attitudes toward risk and guidelines described in yesterday’s blog post. We see discretionary high-risk behavior most heavily concentrated in respondents from the same eastern neighborhoods that tended to report lower perceptions of risk and that the guidelines were less important—South Boston and the Seaport, North End, and North Dorchester. Interestingly, some of these neighborhoods are known for their amenities, including restaurants, bars, and beaches, that were reported over the summer as attracting large gatherings. It is not clear, though, if those visiting these locations were residents are individuals from other neighborhoods or municipalities.
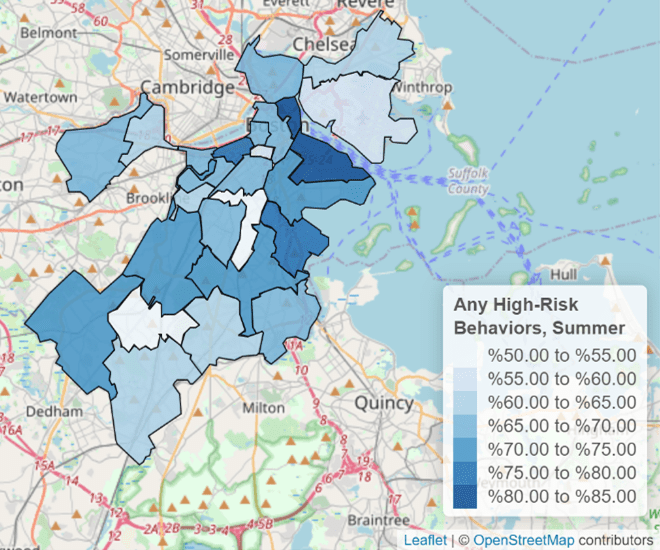
Figure 2. Proportion of individuals engaging in at least one high-risk activity per week in Summer, by neighborhood.
When we transition to racial and socioeconomic variations, we see that White respondents were somewhat more likely to participate in high-risk activities—72% of respondents said they engaged in at least one such activity in the previous week, whereas the same proportion was only around 60% of Black and Latinx respondents and 55% of Asian respondents (see Figure 3). This same pattern is repeated when we compare high-income respondents to lower-income respondents, with the former engaging in more risky behavior. It is possible that this is explained by lower infection rates—and thus lower concern—among these populations.
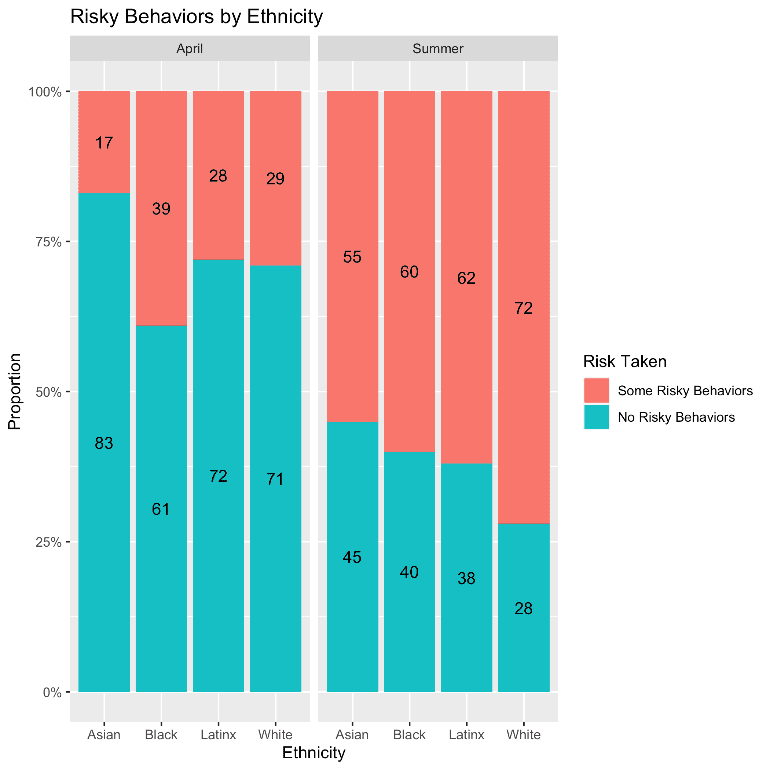
Figure 3. Proportions of individuals participating in at least one high-risk activity per week in April (left panel) and Summer (right panel), by race.
There are two themes here that we highlighted in yesterday’s data story as well. First, there is seeming consensus about the pandemic and how to properly navigate it—but there is still enough dissension from this consensus to create vulnerabilities for communities. Second, the form that these vulnerabilities take will be critical to how policymakers and practitioners support communities during the second wave. Here we see that all communities loosened up their avoidance of high-risk behaviors to some extent. Demographically speaking, this was greatest in White, more affluent Bostonians. But that summary might overshadow the concentration in certain specific neighborhoods along the east coast of the city. We have speculated that this could be related to the destinations in those neighborhoods, but there could be other factors at play. In any case, targeted messaging and education will be crucial as we enter the second wave of the pandemic.
The content of this post is drawn from the Living in Boston during COVID survey conducted by the Boston Area Research Initiative, the Center for Survey Research at UMass Boston, and the Boston Public Health Commission. It was funded by the National Science Foundation’s Human-Environment and Geographical Sciences (HEGS) program through a grant for rapid-response research (RAPID; Award #2032384). The results presented here were part of a longer report on “Inequities in Navigating a Pandemic”.