Talk about vaccines and vaccination is everywhere, especially in terms of the equitability of the vaccination rollout. A major concern is that those communities that have been hit hardest by the vaccine—Black and Latinx Americans, many of whom bear the scars of racially-driven medical neglect and experimentation—are least excited to get it. BARI and our colleagues at UMass Boston’s Center for Survey Research and the Boston Public Health Commission conducted a survey of Bostonians regarding their experience and attitudes during the pandemic, including an item about intentions to be vaccinated.
We found striking racial differences in the intention to vaccinate, much like other surveys conducted by MassInc-Museum of Science and Suffolk-Boston Globe. For instance, 6.6% of White respondents and 1.8% of Asian respondents said they would definitely not get the vaccine, compared to 21.7% of Black and 20% of Latinx respondents. The complete pooled results from these three surveys are in Figure 1.

Figure 1. Vaccination intentions across the three surveys for the general population and by race.
We sought to go beyond these descriptions, however, to do something no one else has done: quantify their implications for community outcomes. To do this, we first combined these ratios with the racial composition of ZIP codes in Boston and municipalities throughout the region (from hereon, “communities”) to estimate the percentage of residents in each who would definitely get vaccinated, definitely not get vaccinated, and who were uncertain. This revealed stark differences, with communities varying between 28.2% and 54.1% of the population saying they planned to get vaccinated, and between 5.1% and 19.8% saying they definitely would not. Figure 2 illustrates these disparities geographically, showing that those who planned to be vaccinated were fewer and those who definitely would not be vaccinated were greatest in Boston—especially the southern majority-minority core of the city—and the high-minority municipalities to the north that have been hardest hit by the pandemic (e.g., Revere, Chelsea, Lynn).

Figure 2. Vaccination intentions by municipalities across the region (left panel) and Boston ZIP codes (right panel), broken down by those who (a) will definitely vaccinate, (b) will maybe vaccinate, and (c) definitely will not vaccinate.
Second, we built a simulation model similar to those used by public health experts and network scientists that models the proportion of individuals in a community who are susceptible to infection, currently infected, and recovered over time (i.e., an SIR model). It also took into consideration movement between communities in approximating the exposure of susceptible individuals and their subsequent likelihood of infection. We ran this model for October-December 2020, using historical infections and mobility data drawn from cell phone records, allowing us to make a clear comparison with what would have happened without vaccination. This model contains a lot of math and assumptions, of course, so we encourage those interested in those details to read the full report.
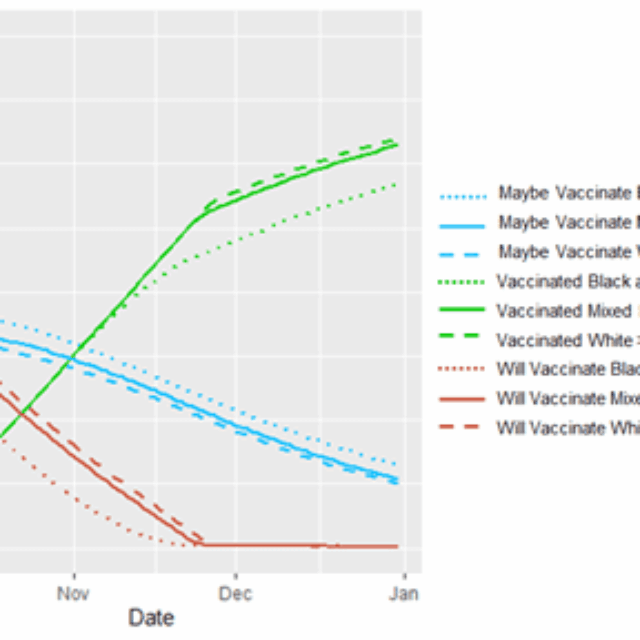
Turning to the results of the model, Figure 3 depicts a steady increase over the three-month period in the proportion of people who were vaccinated across the region, reaching 75%. In late November, however, the vaccination process hit a bottleneck. It had exhausted all individuals who either were willing to be vaccinated at the outset or were persuaded to that point, as indicated by the blue line reaching zero (mean = 53 days into simulation). As a result, vaccination from then on was dependent on those additional individuals who were persuaded in each week, which was less than the rate at which vaccination was possible. This created the kinks in the red and green lines, indicating a slowed vaccination process from that point on, which explains why the simulation did not successfully vaccinate 100% of the population after 12 weeks, despite having the capacity to do so.
The bottleneck in vaccination did not occur at the same time in all communities, however. For purpose of comparison, we divide communities into those that are predominantly White (>80% White residents), have high Black-Latinx populations (>20% Black and Latinx residents), and those that are neither (30% of municipalities and 21% of Boston ZIP codes). Predominantly White communities hit the bottleneck at the very end of November (mean = 57th day). Meanwhile, communities with high Black-Latinx populations hit the same milestone before November 15th (mean = 42nd day).

Figure 3. Percentage of residents intending to vaccinate (red line), will maybe vaccinate (blue line), and have been vaccinated (green line) across the three-month simulation, comparing communities that are predominantly White, high Black-Latinx, and other.
Hitting the bottleneck in vaccination earlier had a sharply negative impact on high Black-Latinx communities, as is apparent from the maps in Figure 4. First, and more obviously, it resulted in vaccination slowing at an earlier time point. Second, and more subtle, it means that when this time was reached there was a lower proportion of vaccinated residents, and thus fewer individuals who could persuade their neighbors. Consequently, fewer additional people were persuaded each week thereafter in these communities than in their predominantly White counterparts. This further exacerbated disparities in cumulative vaccinations. By the end of the simulation, residents in predominantly White communities were consistently 80% vaccinated whereas those living in high Black-Latinx communities were 71% vaccinated—but with some communities seeing rates of vaccination as low as 59%.
The results here are twofold. One discovery is important for all communities. There will come a moment when vaccinations will reach a bottleneck, as we have already seen with the Phase 1 rollout. At this point the rollout becomes dependent entirely on persuasion and falls behind the intended pace. Policymakers and practitioners should be ready to react nimbly to avoid misdistributing or even wasted vaccines.

Figure 4. Percentage of residents vaccinated at the end of the three-month simulation, by the municipality in the region (left panel) and ZIP codes within Boston (right panel).
Second, disparities in vaccination intentions are especially hindering rollout in communities of color in pernicious ways—not only does it slow down the process at the front end, but it is also undermining the power of persuasion as the rollout continues. In tomorrow’s data story we will further explore the implications of this for infections and the attainment of herd immunity.
The content of this post is drawn from the Living in Boston during COVID-19 survey conducted by the Center for Survey Research at UMass Boston and the Boston Area Research Initiative at Northeastern University, in collaboration with the Boston Public Health Commission. It was funded by the National Science Foundation’s Human-Environment and Geographical Sciences (HEGS) program through a grant for rapid-response research (RAPID; Award #2032384). The results presented here were part of a longer report on “The Inequitable Consequences of Vaccination Intentions.”