
Food is a fundamental necessity. This was captured distinctly by the labeling of grocery store workers as “essential workers” throughout the early days of the pandemic. All households need food, but some were more able than others to adopt strategies that diminished the frequency with which they left the home to purchase food, thereby limiting their risk exposure. Our Living in Boston During COVID-19 survey included two measures that can tell this story: one quantifies how many trips people made to either a grocery store or food pantry; the other quantifies how often they ordered groceries or food for delivery.
As we see in Figure 1, the vast majority of individuals made 1-2 trips to purchase food a week, and a minority of individuals ordered food or groceries for delivery once or more weekly. These proportions were rather stable between April and Summer.
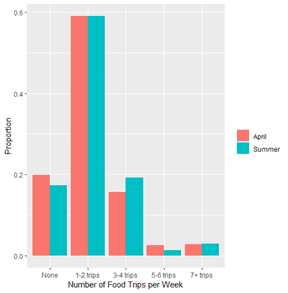
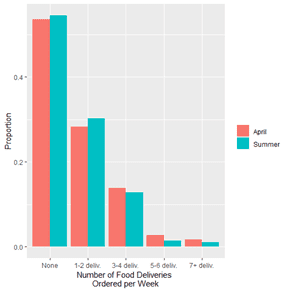
Figure 1. Frequency with which respondents made trips to grocery stores or food pantries (left panel) and ordered food for delivery (right panel) in April and Summer.
This seeming consistency, however, gives way to stark differences in strategies for food access across the socioeconomic spectrum. We can see this geographically in April as respondents from majority-minority neighborhoods in Dorchester, Mattapan, and East Figure 1. The frequency with which respondents made trips to grocery stores or food pantries (left panel) and ordered food for delivery (right panel) in April and Summer. Boston made moderately more food trips. Meanwhile, deliveries were concentrated in the more affluent neighborhoods in the north of the city, from South Boston and Downtown across to Allston and Brighton (see Figure 2). These results were almost exactly the same in the Summer.
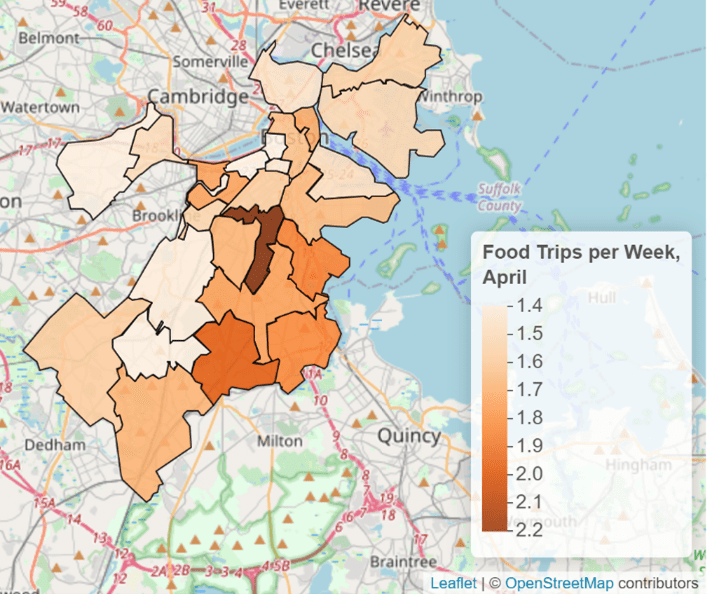
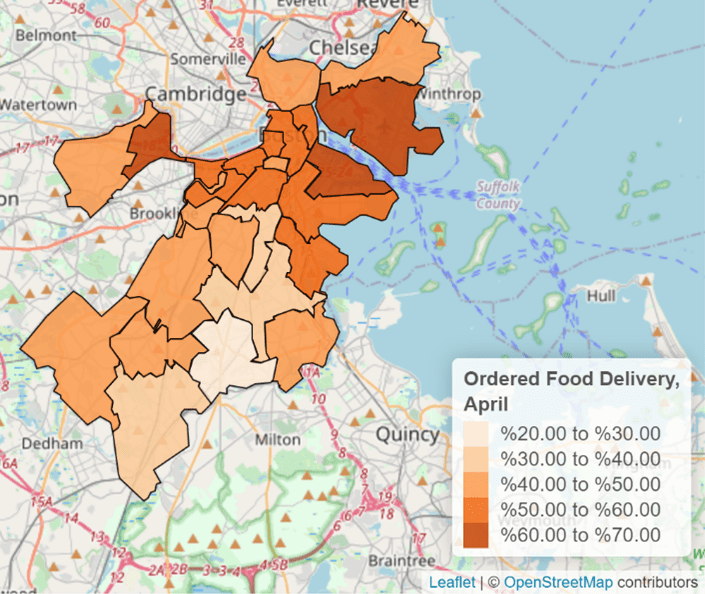
Figure 2. Differences across neighborhoods in weekly food access strategies in April, as seen in the frequency of food trips (left panel) and food delivery orders (right panel).
The disparities in behaviors would seem to reflect the income differences between these neighborhoods. The most obvious interpretation is that individuals with more resources chose to pay the markup for delivery to avoid having to go to the grocery store and potentially expose themselves to infection. Indeed, about 60% of people with income below $75,000 per year reported zero delivery orders in April, but this proportion flipped to 40% for those making more than $75,000 per year.
Alternatively, it is possible that those with more resources started making larger purchases, stocking up on food in order to limit their total number of trips, which may not have been an option for less affluent Bostonians—especially at a time of economic upheaval. For instance, 62% of respondents in the <$30,000 income bracket went on 2 or fewer trips per week, but the same was true for over 90% of individuals making over $75,000. It is worth noting, though, that if we add food trips and grocery delivery orders per week, these differences across income groups disappear. This implies that the primary strategy that higher-income Bostonians adopted for avoiding exposure was ordering groceries, not making fewer, larger purchases.
The disparities we see here reflect differences in the ability to mitigate necessary exposure. Higher income individuals are able to afford delivery services that will transfer their risk of exposure to others, which is less of an option for low-income individuals. This would seem tractable from a policy perspective, however. We might consider subsidizing Figure 2. Differences across neighborhoods in weekly food access strategies in April, as seen in the frequency of food trips (left panel) and food delivery orders (right panel). food delivery for the hardest hit neighborhoods, or helping to arrange food pick-up collaboratives, each of which would lower the need for food trips for individual households. Such investments would be worth the cost if they were to offset infection risk.
The content of this post is drawn from the Living in Boston during COVID survey conducted by the Boston Area Research Initiative, the Center for Survey Research at UMass Boston, and the Boston Public Health Commission. It was funded by the National Science Foundation’s Human-Environment and Geographical Sciences (HEGS) program through a grant for rapid-response research (RAPID; Award #2032384). The results presented here were part of a longer report on “Inequities in Navigating a Pandemic”.